
Category: Reading Specifications Published: 2026/09/10
List card summary: The difference between a single figure and a band-by-band report, and why the reference conditions must always be read alongside it.
The sound isolation figure on a spec sheet looks like the easiest column to compare, yet it is the one most easily misread. Two chambers that both state 40 dB may perform very differently. The difference lies in three places: the reference conditions, the frequency range, and what the figure actually describes.
Noise Floor and Sound Isolation Are Two Different Things

The noise floor describes how quiet the inside of the chamber ultimately is, which is the baseline that really matters during measurement. Sound isolation describes how much outside sound the chamber blocks, which is a property of the structure itself. The two are related but cannot be converted into one another, because the result also depends on how noisy the site is.
Specifications list both. For example, the AN2 has a noise floor of ≤ 20 dBA SPL when external noise is ≤ 70 dB, and sound isolation of ≥ 50 dB SPL above 315 Hz. Read both columns together; comparing only one can easily lead to the opposite conclusion.
Figures Without Reference Conditions Cannot Be Compared

Every sound isolation figure corresponds to a set of measurement conditions. The noise floor of the AC420 is specified as ≤ 30 dBA SPL when external noise is ≤ 70 dB, while that of the AP4 is ≤ 20 dBA SPL when external noise is ≤ 60 dB. The latter figure looks better, but its external condition is also 10 dB quieter. Strip away the reference conditions and keep only the figures, and the comparison loses its meaning.
Factory verification also depends on conditions. Our method is to play pink noise through a reference loudspeaker at a distance of 100 cm to create an ambient sound of about 80 dB SPL outside the chamber, then record the actual sound inside with a reference microphone. Only when the conditions are clearly stated can the figures be reproduced and checked.
Low Frequencies Are the Dividing Line, So Check the Starting Frequency
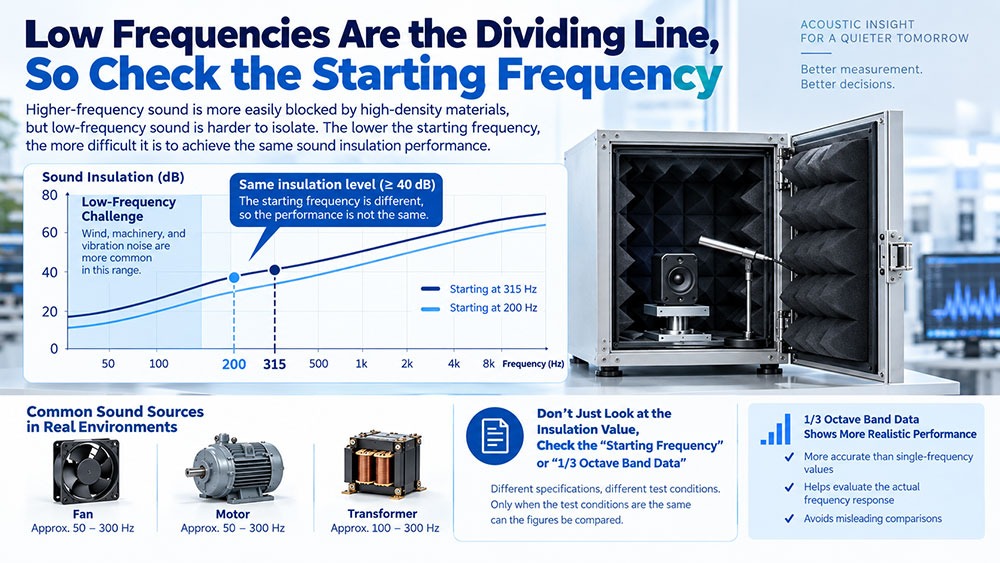
High frequencies are easy to block and low frequencies are hard. This is determined by the structure, so sound isolation is usually stated from a starting frequency: 200 Hz and above for the AC420 and AP4, and 315 Hz and above for the AC600, AC680 and AN2. Two chambers may both state ≥ 40 dB, but starting from 200 Hz is a different challenge from starting from 315 Hz.
If the frequency band of interest for your DUT is low, such as low-frequency noise from fans, motors or transformers, looking only at a single figure will almost certainly lead to a misjudgment. Ask for band-by-band data to see the actual performance.
Ask for a Band-by-Band Report, Not an Average
A single figure summarizes the entire frequency range and hides the weakest band. Only a band-by-band analysis in 1/3 octaves shows the actual performance in each band. We test the sound isolation of every anechoic chamber individually before shipment, issue a report with band-by-band data, and ship only after confirming that it meets the specification. This is done on every unit, not by sampling.
When requesting this report from a supplier, also confirm three things: the external noise conditions during measurement, the microphone position, and the frequency range covered by the report. Only with all three in place do the figures hold up.
Every Opening Is a Path for Sound Leakage
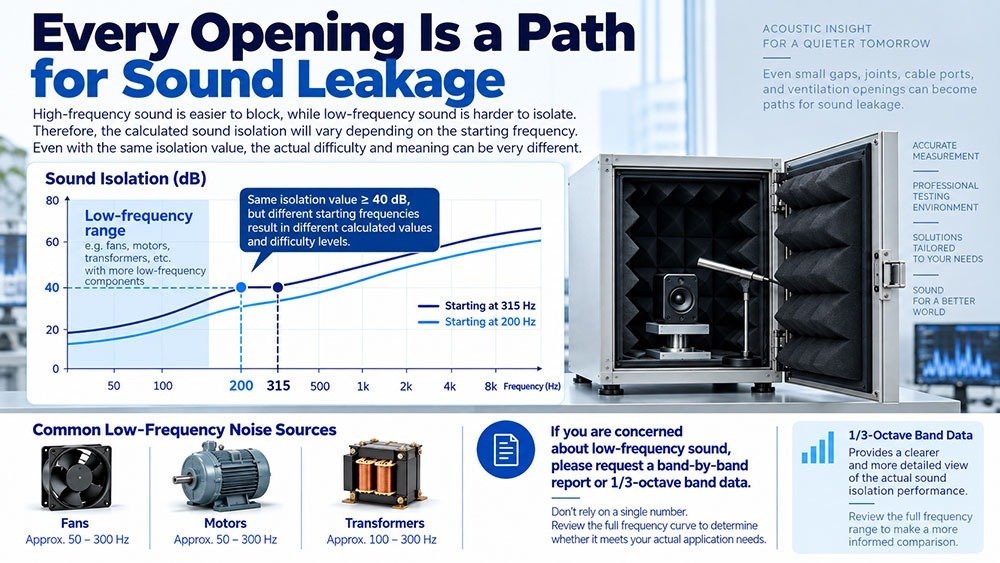
A sound isolation figure is the result of the whole chamber, not of the wall panel material alone. The compression of the door seal, the glass and frame of the viewing window, the way the cable ports are sealed: if any one of these is not handled well, the overall performance is dragged down by that single point, and this is almost impossible to see in a single figure.
So when reviewing specifications, besides the figures themselves, ask which openings the chamber has, how each one is sealed, and in what state the factory report was measured: an empty chamber, or one with cables routed and fixtures installed. The gap between the two is often the gap you will see in actual use.
Align the Conditions Before Comparing Quotes
Suppliers do not necessarily state their figures the same way, so placing the numbers side by side is almost meaningless. Before comparing, standardize three things: the external noise reference, the starting frequency, and whether the figure refers to the noise floor inside the chamber or to the sound isolation of the chamber. Once the conditions are aligned, the differences that remain are the real ones.
If you have several spec sheets to compare, send us the noise conditions on site and the frequency band of interest for your DUT, and we can help you interpret them.
AI-Acoustics Technology Co., Ltd. service@ai-a.com.tw +886-3-360-9617